With Kavanaugh vote, the Senate reaches a historic low in democratic metric
The disconnect between the United States Senate and the American people has never been greater. If you thought the Senate has gone off its rails, the numbers back you up.
The Senate majority represents a historically low proportion of the country’s population.
Based on a new analysis of Senate votes from 1901 to the present, we found that beginning last year senators voting in the majority represented a historically low proportion of the country’s population.
In yesterday’s vote to confirm Justice Kavanaugh, the 50 senators voting yes represent states covering just 44% of the U.S. population or 143 million Americans. That’s less than a majority, less than the 181 million Americans represented by the senators voting no (you might say the “Senate popular vote”). Yet the nomination was confirmed.

That 6-point advantage has never been used so much as in the last 21 months. Justice Gorsuch was confirmed by 54 senators representing only about 45 percent of the population (as Ian Millhiser wrote in ThinkProgress). Similarly for five circuit court judges, several other of President Trump’s nominations, last year’s tax cuts, and ten laws rolling back Obama-era regulations including one that erased an Internet privacy regulation (with 50 senators representing 43 percent of the population voting in favor).
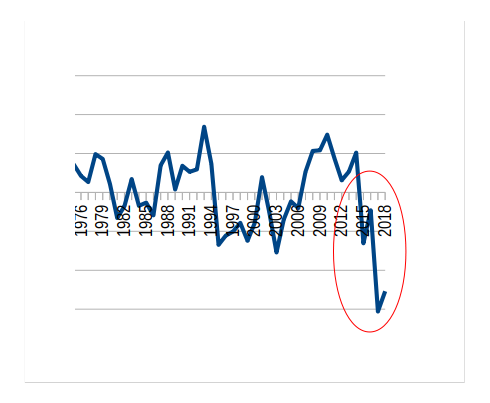
Until 2017, the average discrepancy between the percentage of senators voting yes in a roll call vote and the percentage of the U.S. population they represented was just a few percentage points. Despite the populous states leaning Democratic, at least recently, most Senate votes nevertheless came out in proportions that reflected the population as a whole. That changed in 2017, when the average discrepancy spiked:

After the 2016 election it was widely reported that while more Americans voted for a Democratic senator, Democrats only took a minority of Senate seats. That’s because Senate seats are assigned two per state, no matter whether the state has 40 million residents (California) or 0.6 million (Wyoming). Republicans picked up many of the seats in less populated states. (Since congressional districts are more evenly sized, House of Representatives votes have much smaller discrepancies between representatives voting yes and their the number of their constituents.)
Hundreds of votes since 1901 have had as large a discrepancy between votes and voters as yesterday’s confirmation vote. Congress’s FY2016 budget resolution passed with 51 votes in the Senate from senators representing just 41 percent of the population, for instance. But out of hundreds of thousands of votes since 1901, in less than 2,000 did the yes votes have a majority of senators but less than half of the population.
What changed?
Population changes are too small from year to year to explain the spike in 2017. (In fact, the graph looks very similar even if all population change is removed.)
Sen. Duckworth’s win in Illinois, flipping the seat in the 5th most populous state from Republican to Democrat, was a contributing factor.
But mostly it was the rules.
The slim Republican majority has been using — and creating — procedures to get more passed with fewer votes now that the president, a Republican, is no longer an obstacle in the way of their policy goals. Starting with Gorsuch, the effective vote threshold for confirming a Supreme Court Justice has been 51 instead of 60. And they have used the Congressional Review Act, which expedites regulation cutting legislation by also reducing the effective vote threshold in the Senate. Although other legislation is still subject to the filibuster (and also must pass a House vote where these discrepancies are smaller), narrow margins on amendments and procedural votes are now routine.
Since 2017, the percent of Senate votes decided by a slim margin has gone up to a record-breaking high:

Smaller margins exacerbate the discrepancy between Senate votes and American voters. All things equal, a vote with a smaller margin will have a higher discrepancy. (Browse those votes here.)
The new minority rule
The Founding Fathers designed the Senate to be a check on the rule of the majority. Senate rules and precedent such as the filibuster, hold, and blue slip have long given the minority viewpoint extra powers in preventing majority rule. There’s nothing inherently wrong when a minority group controls an outcome —that’s part of the design and dream of the American system of government.
But we may have begun a sustained period of minority rule (and not just in the Senate, but also in the White House where the president was elected by a minority of voters). The President and Senate’s willingness to move forward with small margins and a coalition of senators representing less than half of the population puts the legitimacy of the institution at risk.
It’s no accident.
It’s no accident that the Senate majority and President were elected by a minority of the American population. The Constitution deigned the Senate and the Electoral College this way, yes. But fate is in the hands of man.

1.5% of the U.S. population still isn’t represented in the Senate at all. If the residents of Puerto Rico, who outnumber the residents of 21 states (and currently elect a Republican delegate to the House) and the District of Columbia, who outnumber and pay more taxes than the residents of two states (and vote Democratic) had senators, things would look a lot different.
The United States has come a long way, but we have further to go in ensuring all people are represented fairly in government. Representation in the Senate for all Americans should be an imperative.
Methodology
- We looked at all Senate roll call votes from 1901 to the present, including votes on amendments, cloture, and other motions, in addition to nominations and legislation. We only considered votes that were not unanimous and where the yes votes outnumbered the no votes. Note that the yes’s didn’t prevail in all of these votes — the threshold for some votes was higher than a majority.
- Votes before 1989 were sourced from VoteView.com by Keith T. Poole and Howard Rosenthal at Carnegie-Mellon University. Votes starting in 1989 are from Senate.gov. See https://github.com/unitedstates/congress.
- Historical state population was sourced from the U.S. Census’s Annual Estimates of the Population for the U.S. and States as published by the Federal Reserve Bank of St. Louis. For each vote, we used state population data from the prior year (since 2018 population data is not available yet).
- To compute the percentage of the U.S. population represented by the yes votes, we apportioned each state’s population evenly among the senators representing the state (which may be less than two when there are vacancies) and then divided the sum of the population corresponding to the yes voters by the sum of the population corresponding to the yes and no votes. Senators not voting, as well as the populations of the six U.S. territories, are excluded from the analysis.
This post was written by GovTrack founder Joshua Tauberer.